Population decline 2025 – a turning point for the housing market

For the first time in over a decade, Germany’s population is shrinking – 2025 makes it official, but our data show that the shift has already been under way since 2023 and is affecting almost all regions.
For the first time since 2011 (with the exception of the pandemic year 2020), the population fell in 2025 (‑110,000 people / ‑0.1%). The net migration gain has been shrinking rapidly since the 2022 Ukraine peak, while the natural population change remains structurally negative and has recently fallen even further. Figures available so far for the first half of 2026 suggest the trend is continuing – and even intensifying. Population decline is therefore likely to be even higher in 2026 than in the previous year. But what does this mean for the housing market?
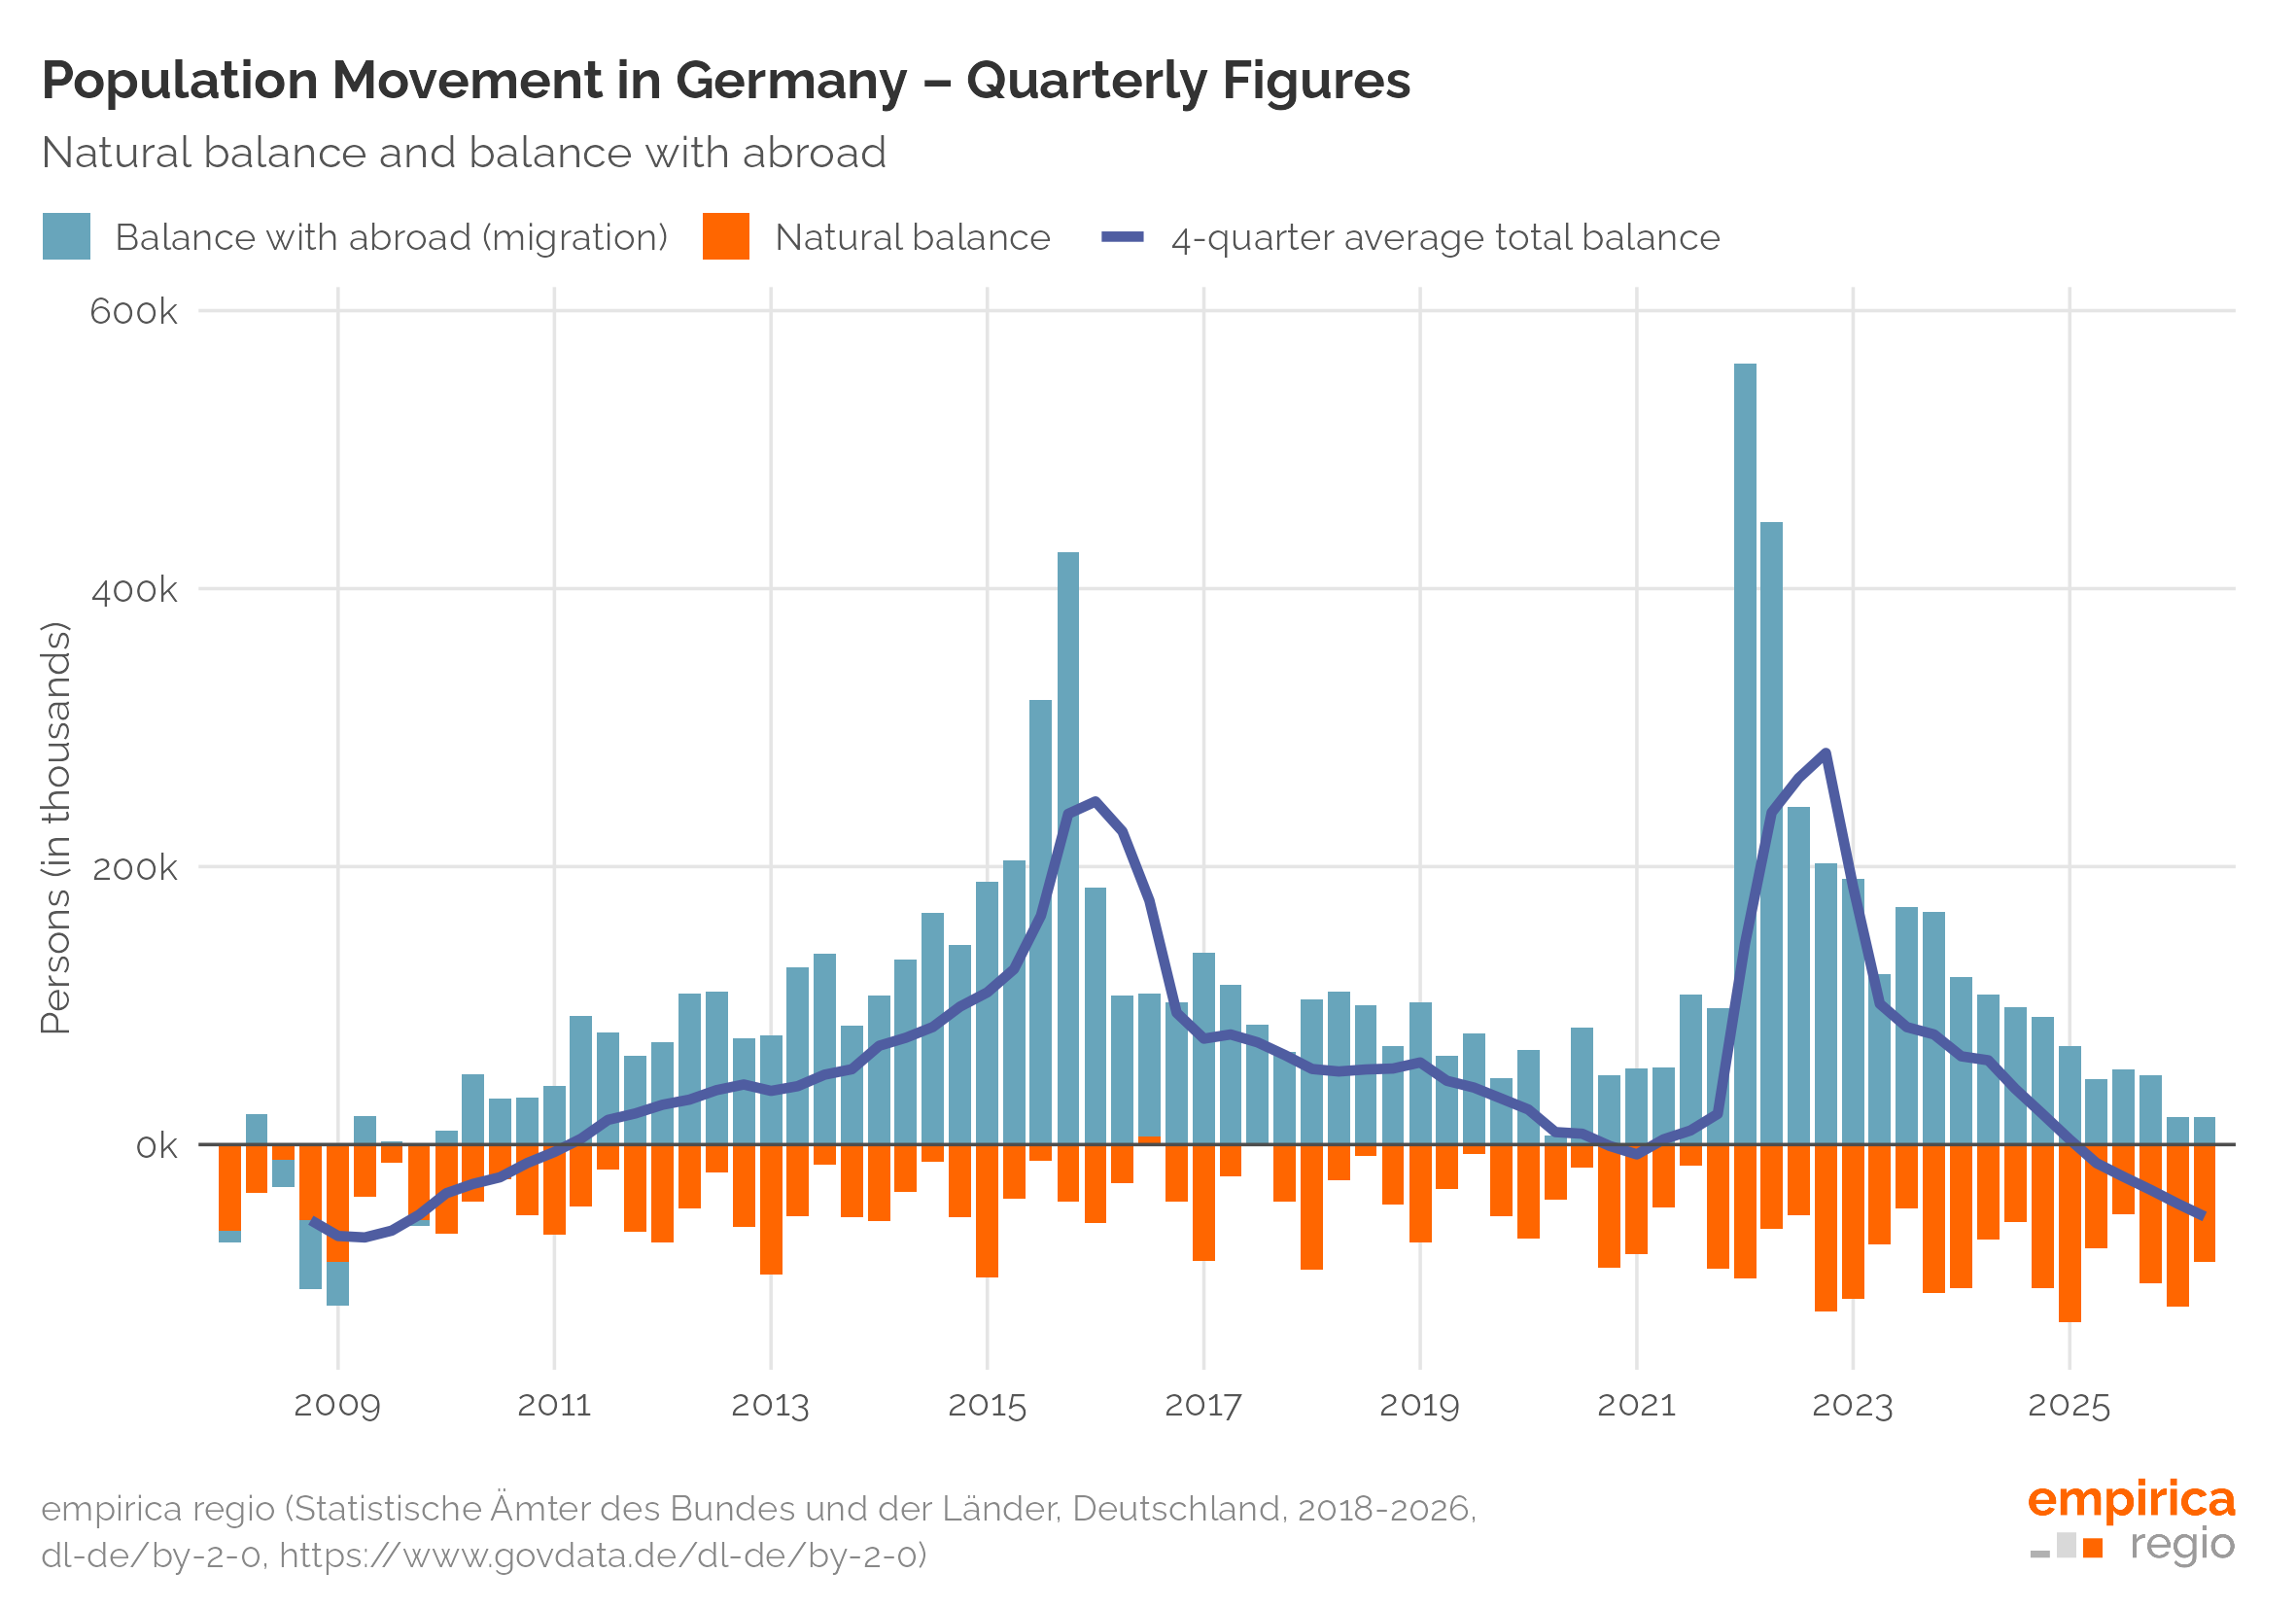
This blog post examines why the absence of migration gains and the renewed population decline are still no sign of relief (for now). The analysis is based on statistical data from the federal and state statistical offices, newly published this summer for the year 2025. The household figures are based on the empirica household model.
Regional trends in population development
The centre-periphery divide is returning, albeit at a lower level: after the outlier years 2015 and 2022, which saw high immigration, even metropolitan areas are growing noticeably more slowly or stagnating in 2023–2025, while the periphery is once again shrinking more sharply. The population dynamics that shaped the last housing market cycle – driven by high immigration into Germany and strong internal migration of young people into cities – are clearly slowing down. Population growth had already weakened after 2015, before immigration surged again abruptly with the start of the war in Ukraine.
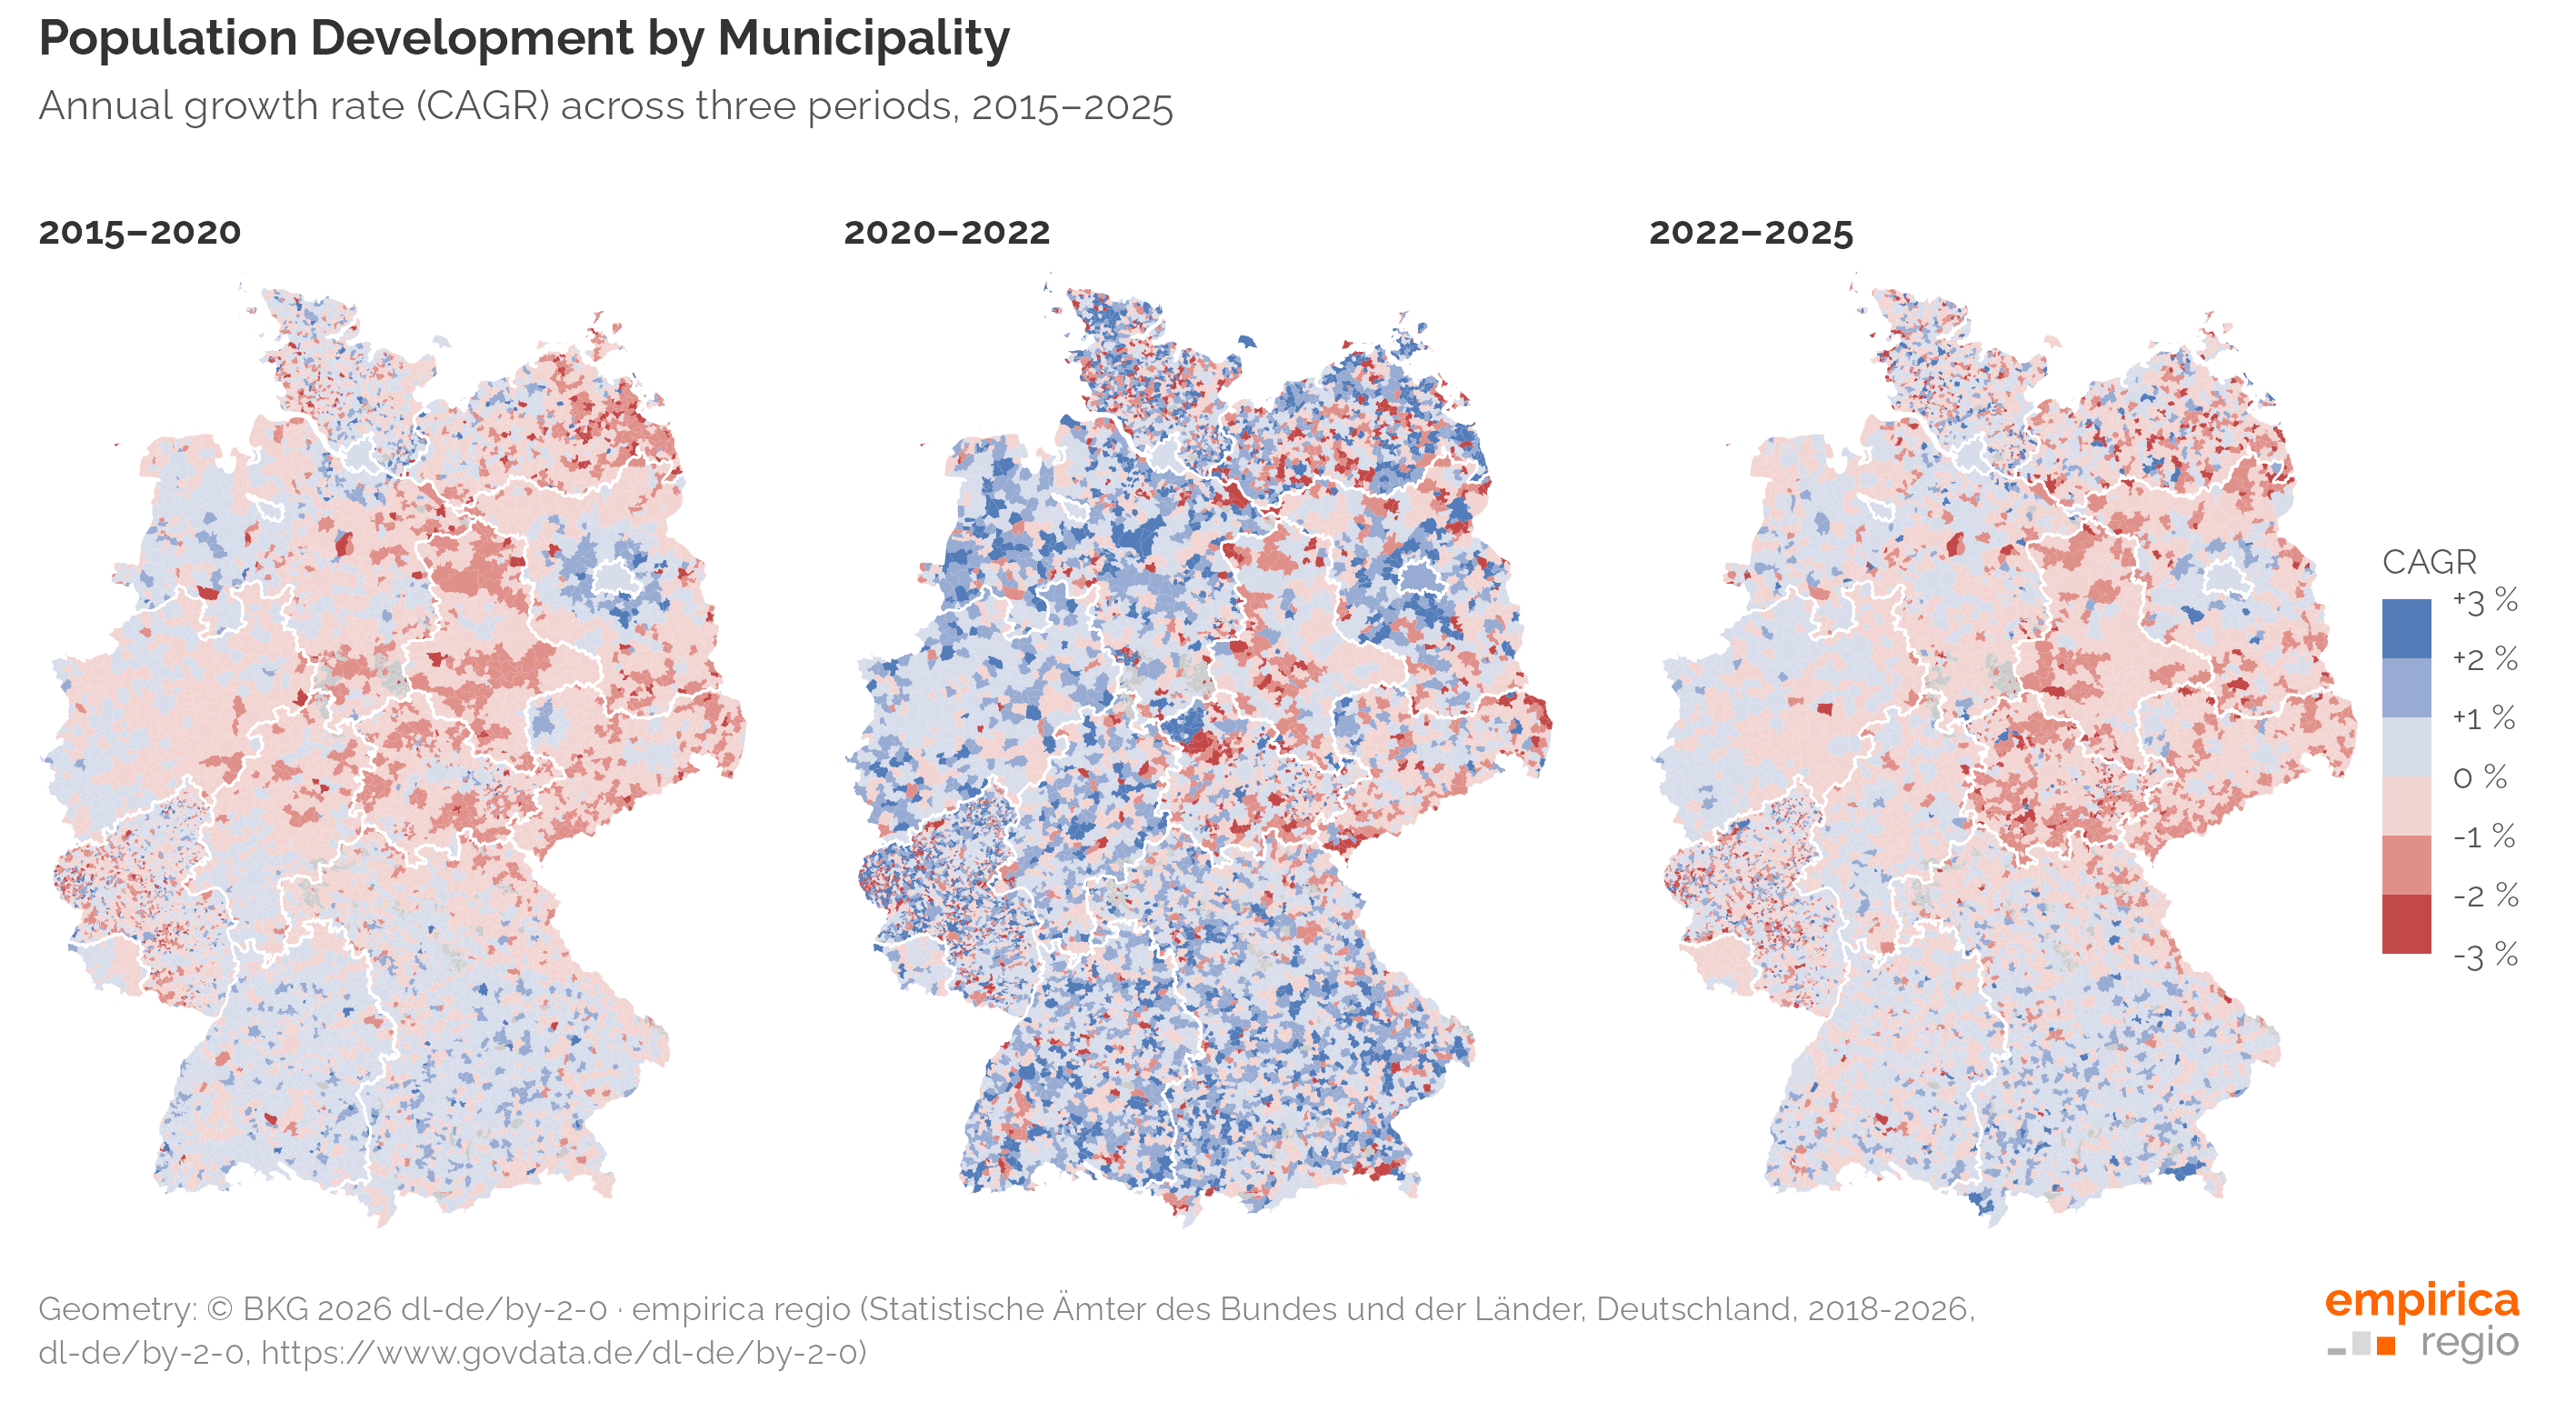
Regions in the west are shrinking too (southern Lower Saxony, northern Bavaria, Saarland, the Eifel), while Berlin stands out as an island of growth in the midst of a shrinking east. The east-west divide is thus continuing to erode. But even in growth regions, the surrounding-area growth of previous years is cooling off. The likely cause of this declining suburbanisation is the rise in interest rates for mortgage loans. It is currently uncertain when, and to what extent, those who postponed a move to the suburbs will catch up on buying property there in future.
How household shrinkage has shifted since 2005
The trend towards smaller households is clear, but the story behind it is more nuanced than the constant focus on single-person households alone suggests. Across all household types, the number of single-person households is growing fastest everywhere, but least strongly in large cities. In the chart below, the index stands at 139 in sparsely populated rural districts, compared with only 123 in large urban districts. The trend towards smaller households, once mainly an urban phenomenon, has shifted towards rural areas in recent years.
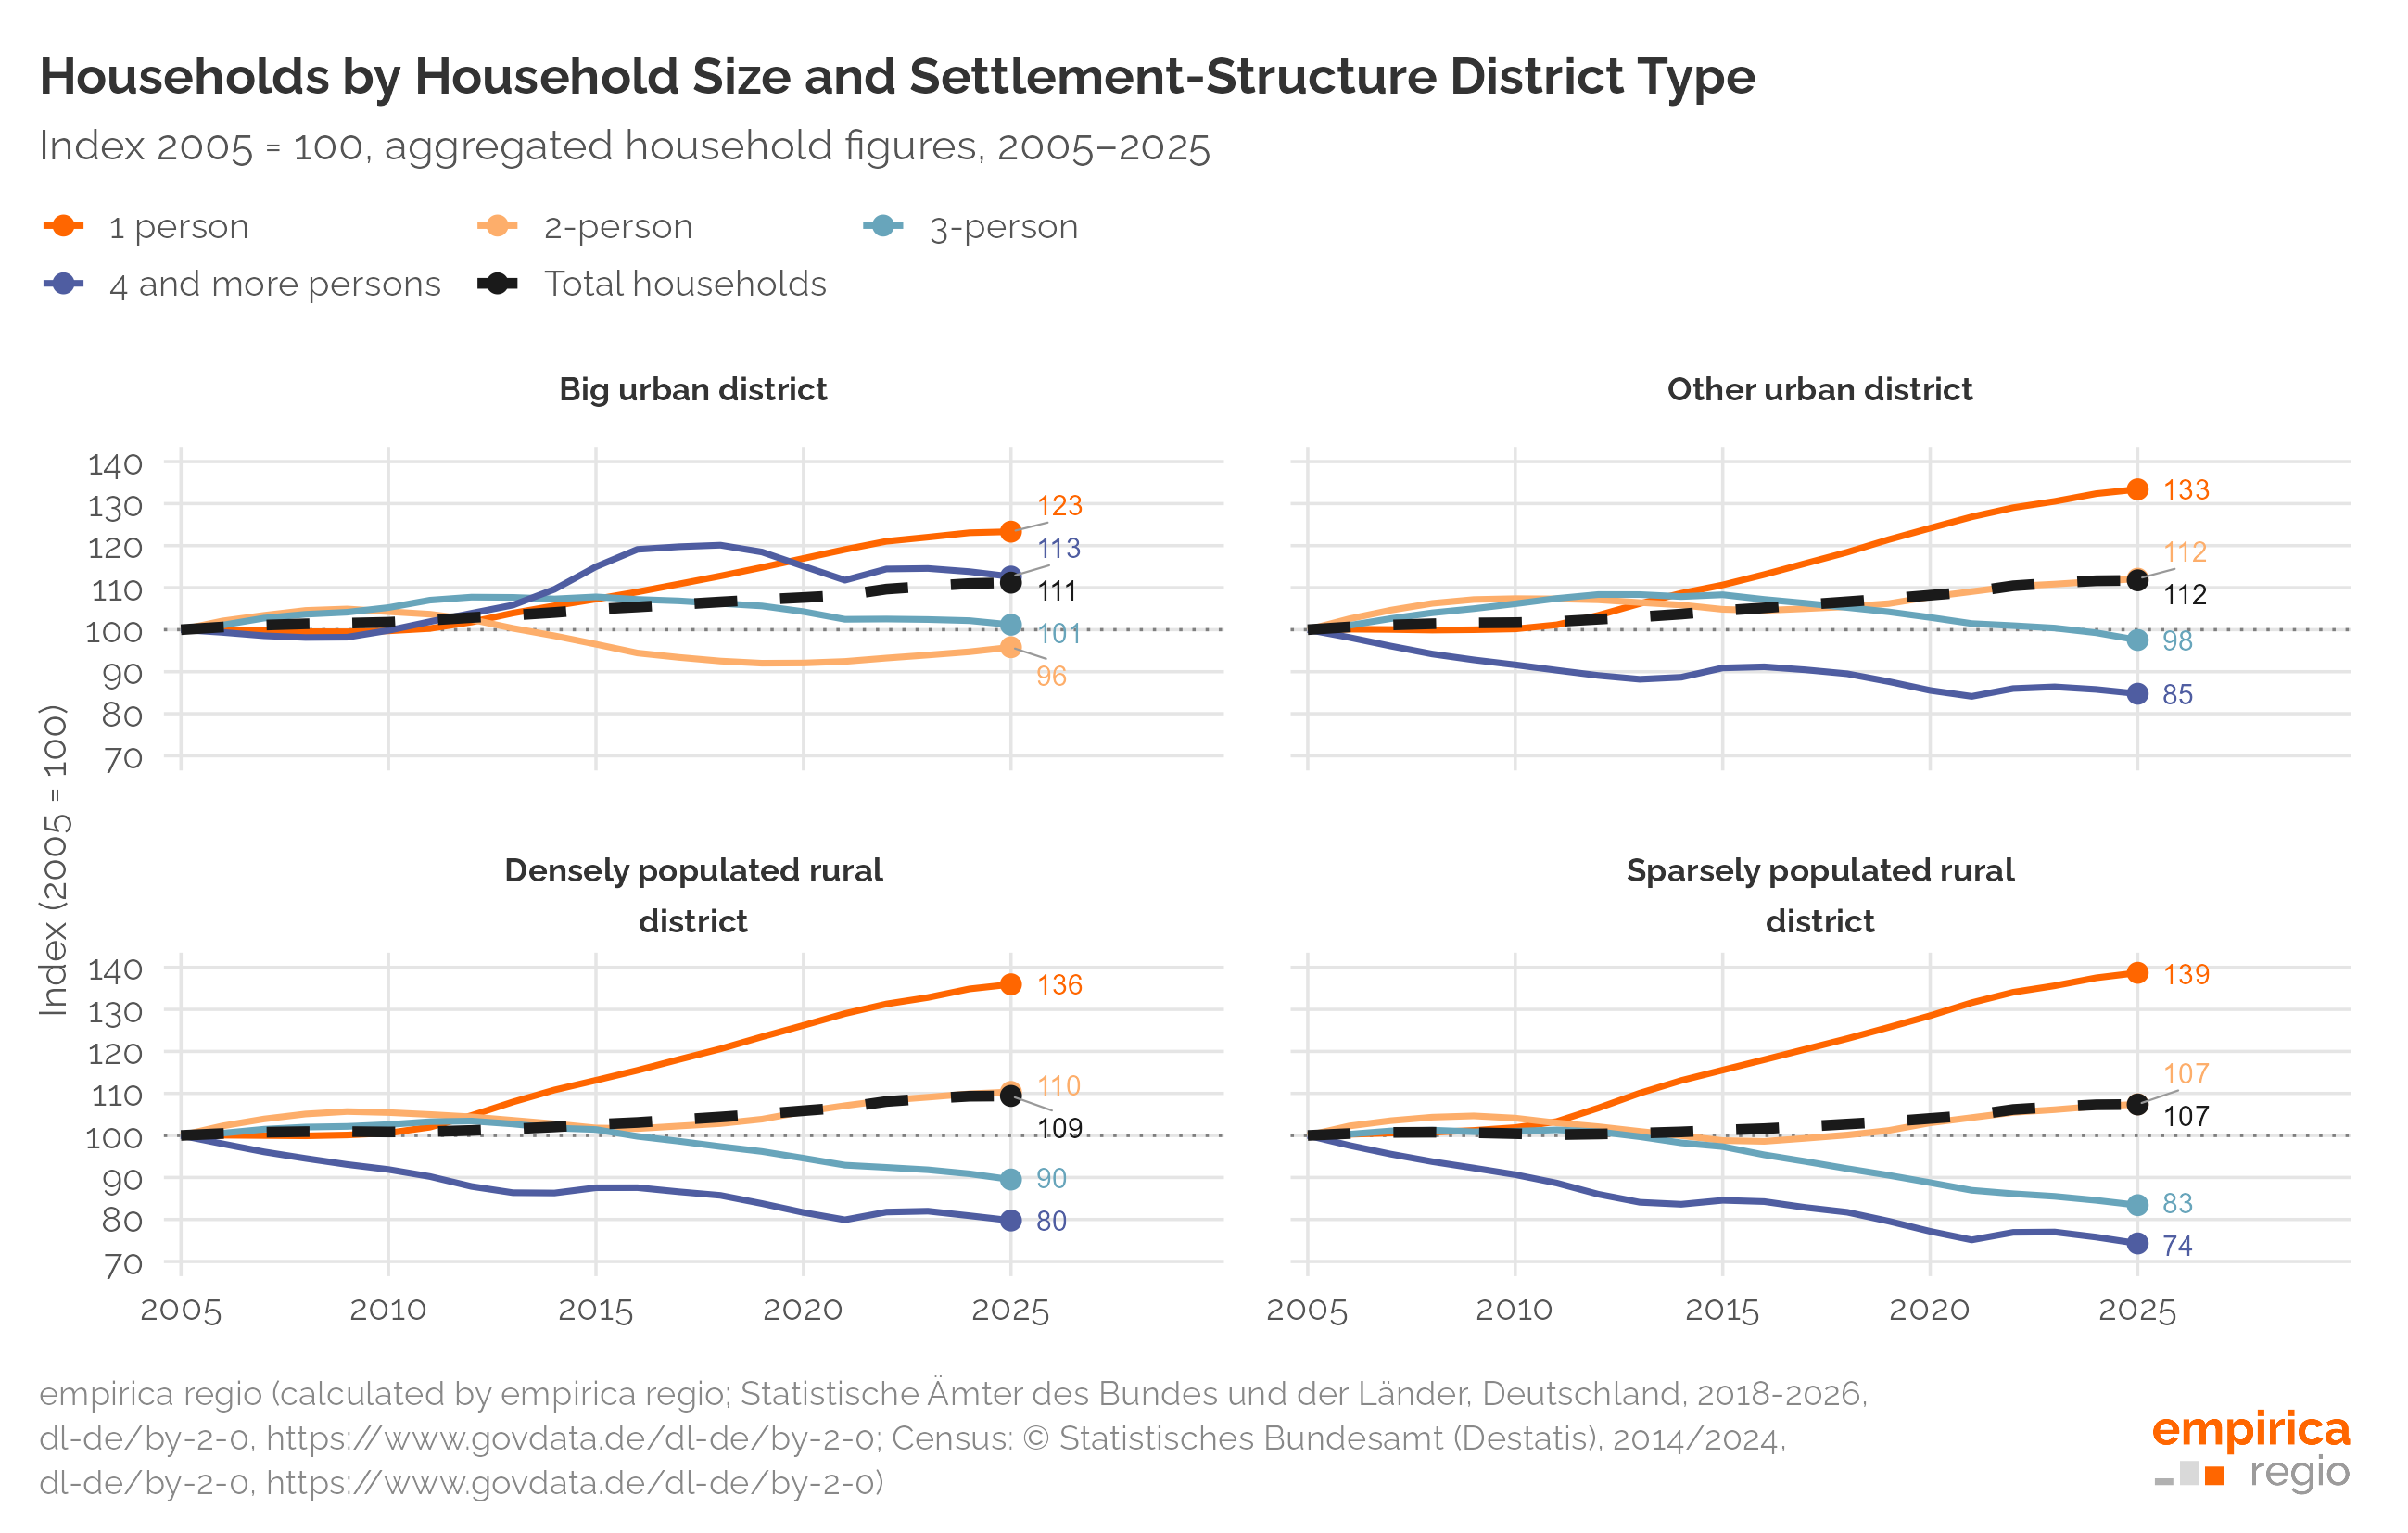
Large cities are keeping the share of large households high. After peaking in 2015–2018, the index for households with four or more people there still stands at 113 – whereas it has fallen much more sharply in urban and rural districts. In cities especially, internal migration and immigration from abroad have stabilised the average age of the population, weakening the effect of ageing as a driver of household shrinkage.
The total number of households is growing in all four district types considered, but for different reasons: the number of one- and two-person households rose nationwide from 25.7 to 30.6 million (2005–2025), while average household size fell continuously over this period to 2.04. In ageing districts, the increase is purely structural, driven by shrinking household sizes, and is therefore less closely tied to local population growth. In regions with net immigration, by contrast, both household shrinkage and the arrival of young households and the formation of new families are at work at the same time.
For housing demand, this means the focus cannot be on small households alone. Once households occupy a larger dwelling, they do not simply give it up despite their reduced space requirements – young families therefore cannot rely solely on such dwellings becoming vacant again, but need an additional supply of affordable, family-friendly housing.
Building permits are recovering somewhat – but is more actually being built again?
Population and household trends indicate how demand is changing in a region. But how has supply developed recently? Official data on building permits and completions at district level show a mixed picture. Permit numbers are picking up somewhat, but completions have so far followed only hesitantly, if at all. On the one hand, depending on the project, completion can take one or several years (owner-occupied homes tend to be quicker, multi-family houses considerably longer); on the other hand, actual construction times are currently longer because of the crisis. And some projects, despite having a permit, are probably simply on hold for now. Similar effects were already observed after the 2008/2009 financial crisis. The good news back then: ultimately, the share of projects that were never realised because of the crisis rose only slightly – from 4–5% to 7% of the 2008 permit cohort.1
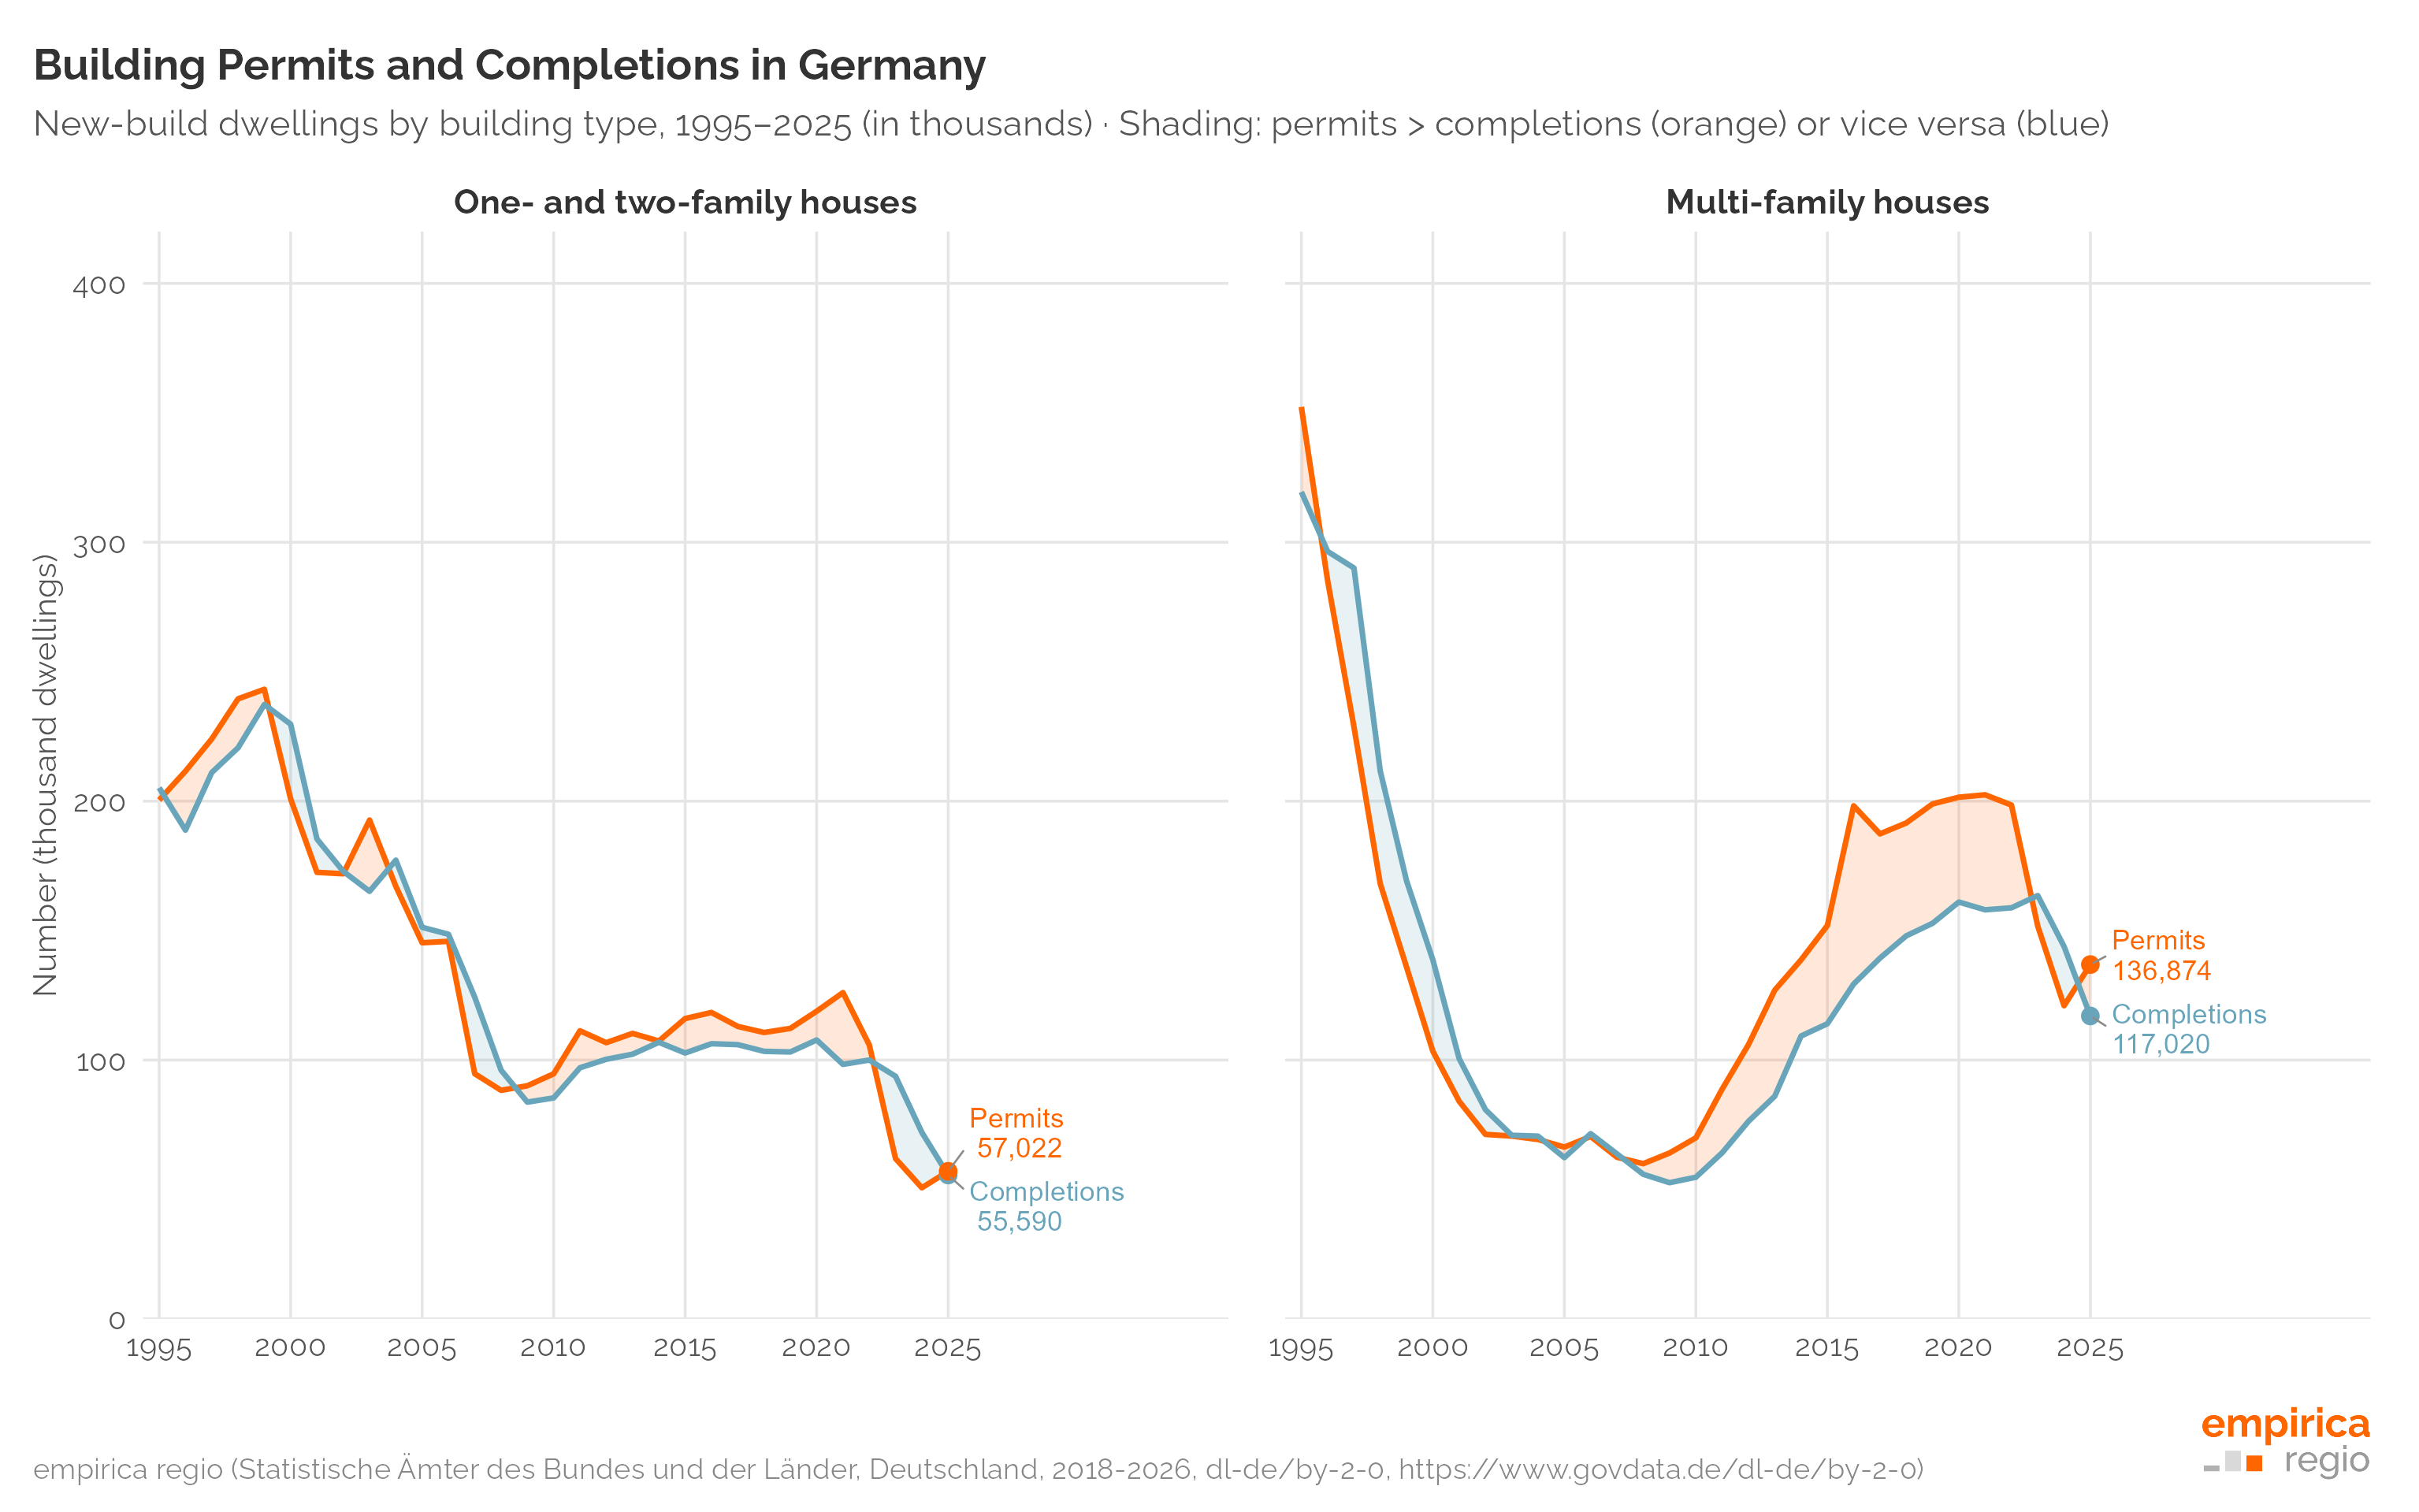
The recent housing construction boom took place almost exclusively in multi-storey housing, while completions of owner-occupied homes continued at a fairly constant level. The collapse in completions from 2024 onwards occurred both in multi-storey housing and in one- and two-family house construction. This decline in completions is showing up almost everywhere: completions fell in all region types from 2024 onwards.
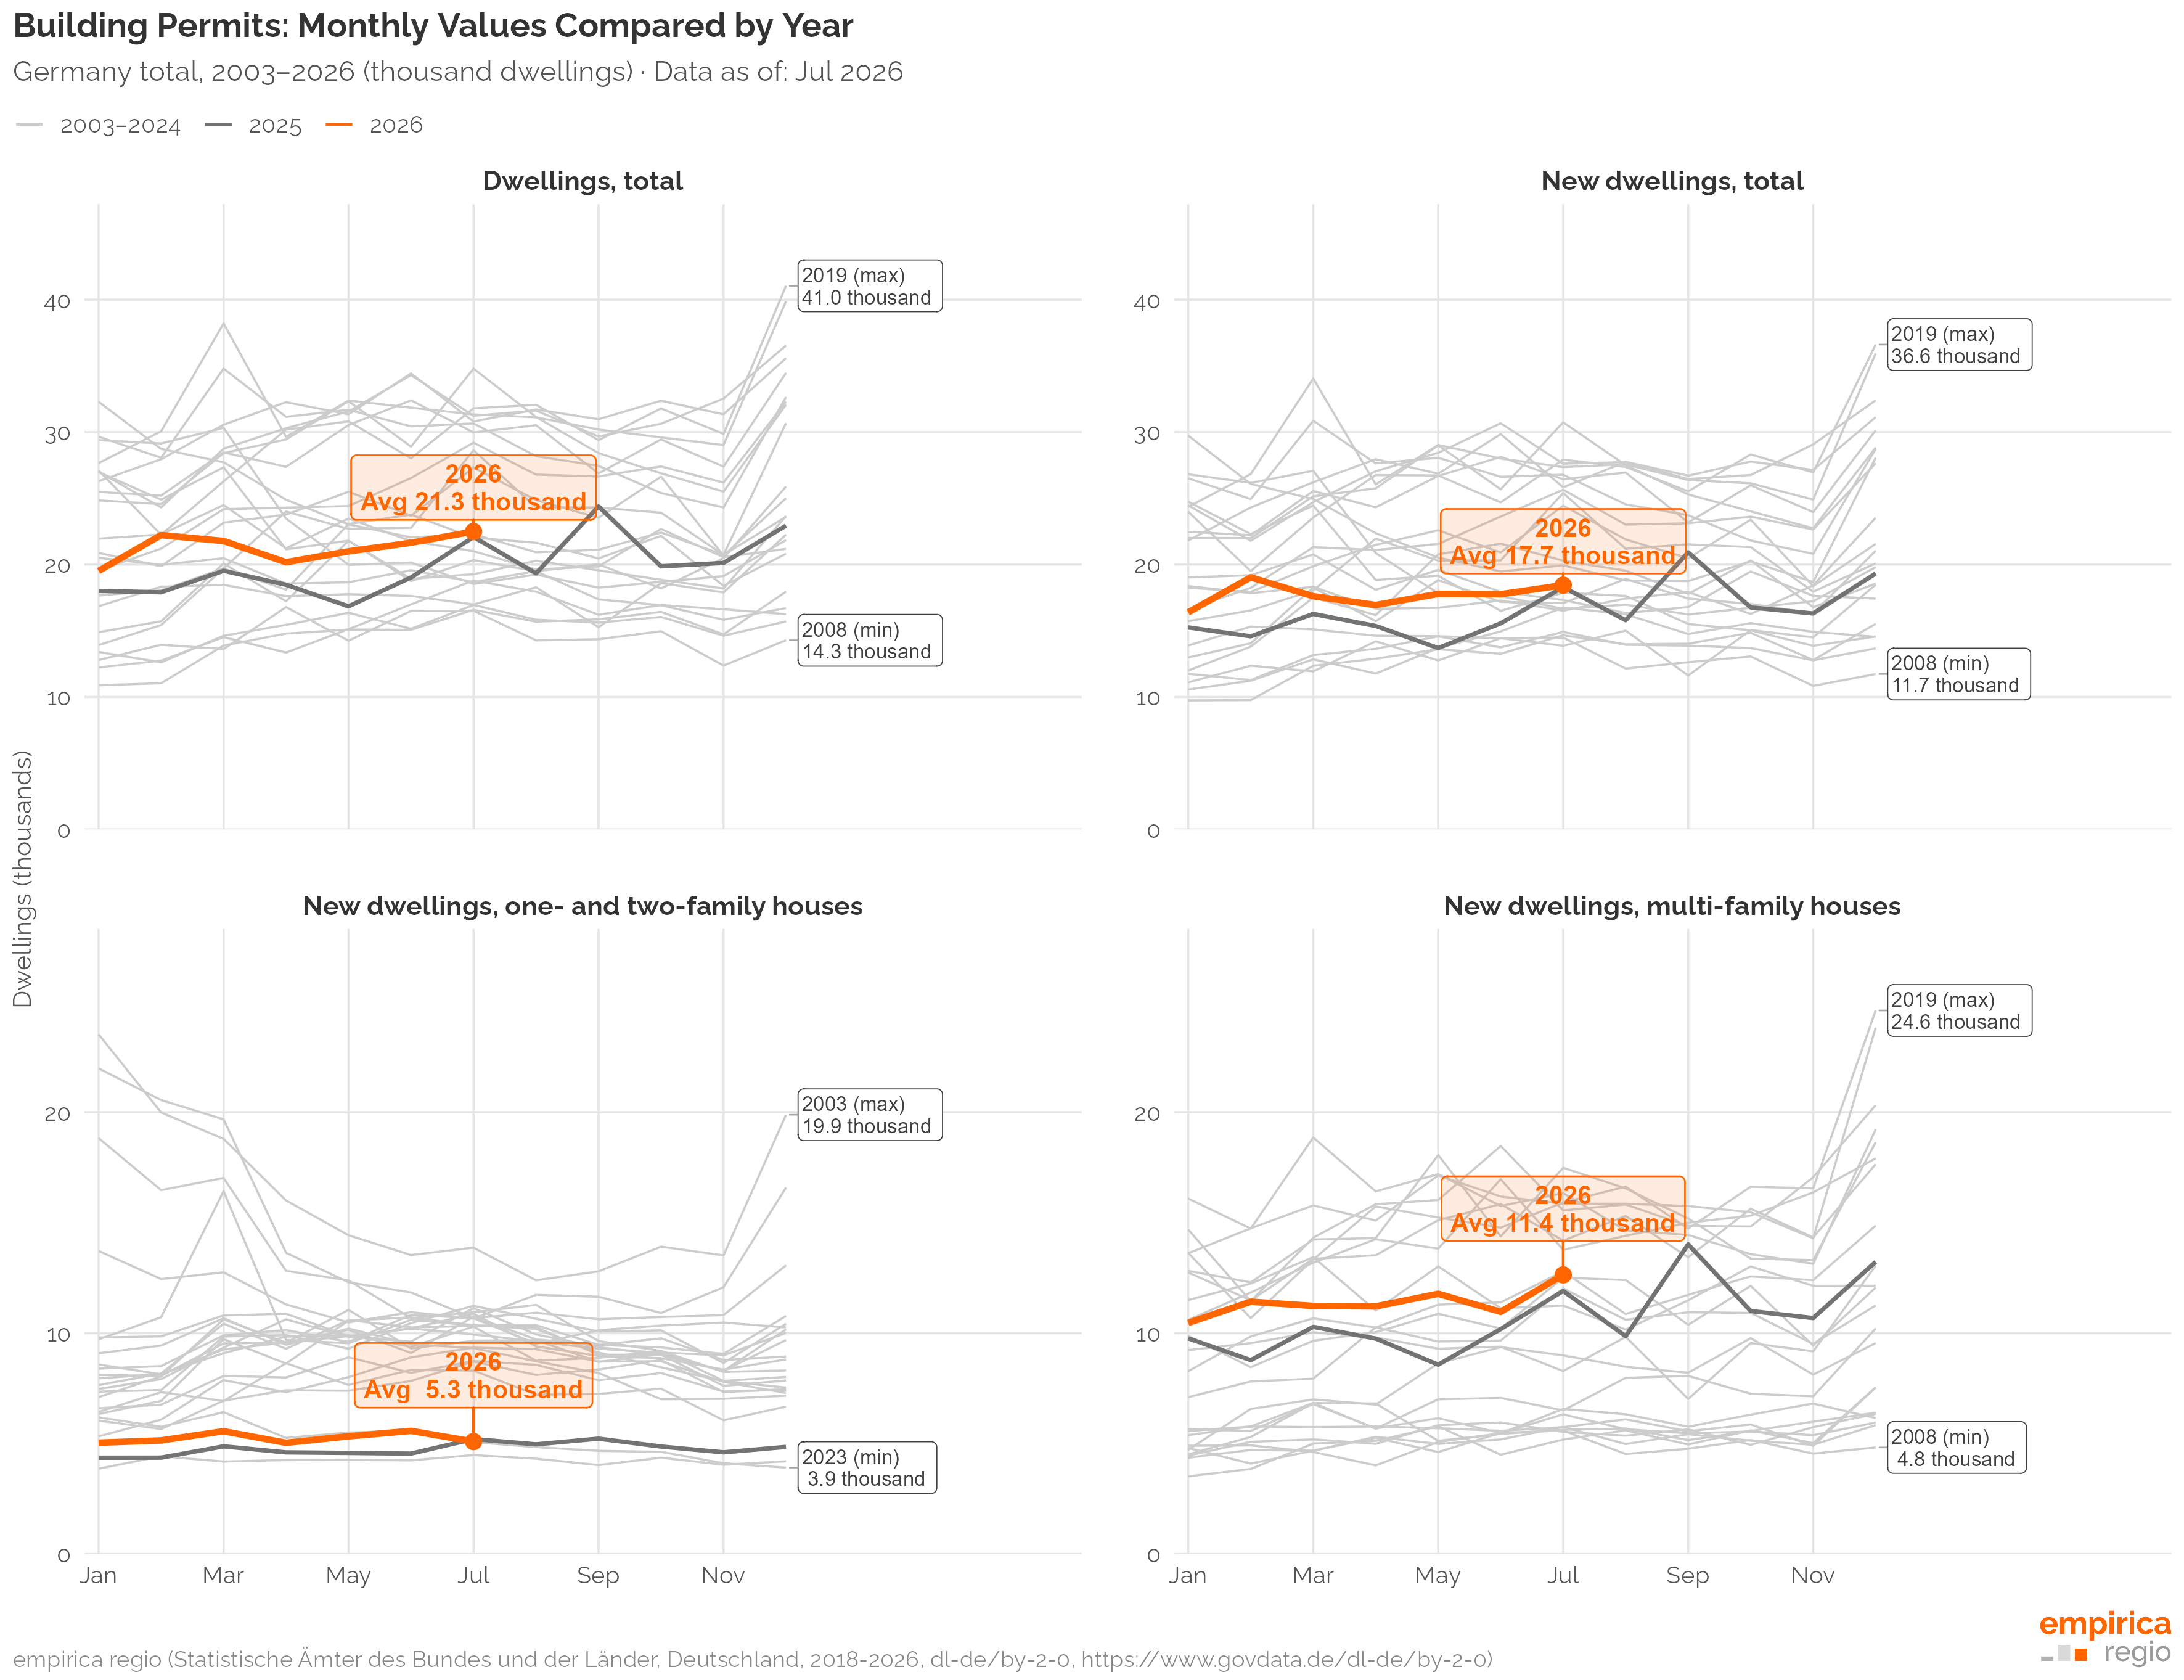
For Germany as a whole, the latest monthly figures up to July 2026 confirm the slightly positive trend in permits: the average stands at 21,300 dwellings per month (2025: 19,900) – the recovery is continuing, but remains behind the boom years. Looking at the monthly figures also shows how unusual the current decline in one- and two-family house permits is: they currently stand at a very low level comparable to 2003, and unlike in multi-storey housing, no recovery is yet in sight.
Summary
Even though Germany’s population is shrinking for the first time since 2011, housing demand is not falling at the same pace: the continued shrinkage of households – most recently above all in rural districts – has kept the number of households growing. This trend is likely to slow further in future, and in some regions the growth in the number of households could stop altogether if population decline continues. On the supply side, the picture is mixed: building permits are recovering from a very low level, so far mainly in multi-storey housing, while completions are lagging behind as expected. For now, this demographic brake is therefore unlikely to bring any relief to the tight markets in the major cities.
A recent analysis from our own house shows that a numerically growing housing stock, or a shrinking population, does not on its own mean any relief for the housing market: between 2011 and 2024, the national housing stock grew faster than the population – yet housing shortages worsened in many places. What matters, according to this analysis, is not the total stock but the supply that is actually market-relevant, i.e. genuinely available.2 The decline in new housing construction triggered by the rapid rise in interest rates accelerated markedly in 2024 and 2025. Given the recent rises in interest rates and construction costs, the question also arises of how quickly an increase in permits can actually translate into a real increase in new dwellings.
Data sources
Simons, Harald; Weiden, Lukas; Salla, Arnaud (2023): Structure and reasons for the construction backlog, empirica study commissioned by the BBSR, BBSR Online Publication, 07/2023, Bonn. p. 34. External download [in German] ↩︎
Simons, Harald (2026): On the causes of the misery in the housing market. Why housing shortages can exist even though there are enough dwellings. empirica paper No. 279. External download [in German] ↩︎